If you’ve been researching online about crossover design and tried inputting values into a crossover calculator, you might believe that you’re prepared to dive into the realm of professional audio. You might feel ready to embark on designing your own speakers and crossovers. However, once you start the actual process, you’ll quickly realize that theory and reality exist in separate realms, particularly true when it comes to passive crossovers and speakers.
So, what’s the challenge? The primary hurdle stems from the fact that nearly all online crossover calculators, textbooks, and the typical approach taken by beginners in crossover design make the assumption that both the Woofer and Tweeter possess an impedance of 8 ohms. Moreover, this assumed impedance remains constant across all frequencies, and their frequency responses are both flat and balanced. However, this is where reality intervenes. Once you begin examining the impedance measurements and frequency responses of the actual components you intend to use, the issues become readily apparent.
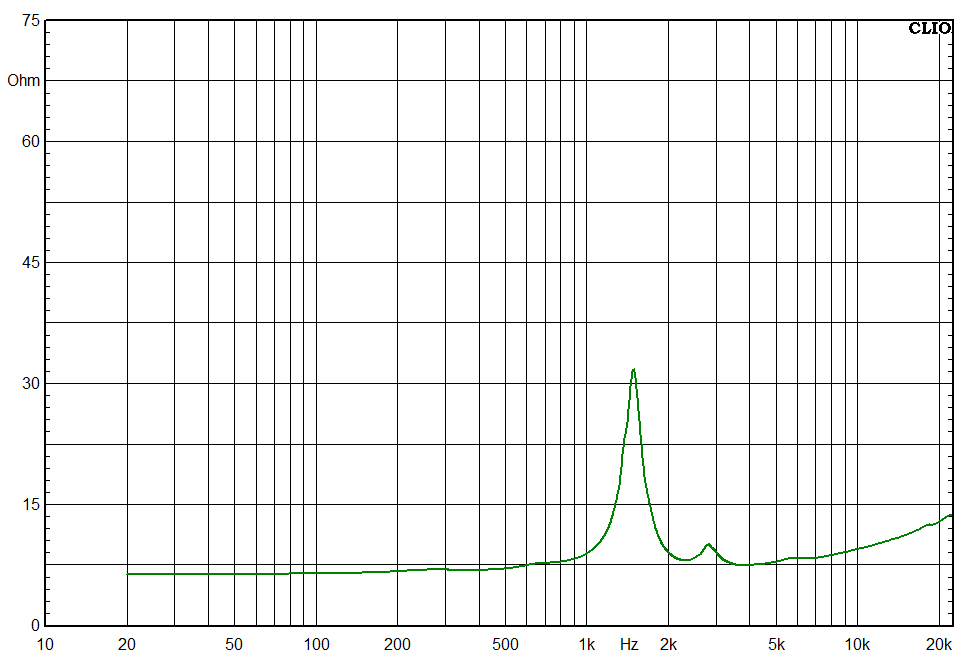
For our illustrative project, we’ve opted to work with a well-known 8″ PA Woofer: the B&C 8NDL51. Analyzing the graph below, we can observe that the impedance sits at 8 ohms around 800Hz. Consequently, at this frequency, our theoretical crossover derived from an online calculator should perform as expected in the real world.

However, our goal is not to establish a crossover point at 800Hz. In order to align with a smaller tweeter, we aim for a crossover frequency around 2500Hz or slightly higher. At the 2500Hz mark, the woofer’s impedance measures around 11 ohms and continues to rise beyond this point. If we were to input 11 ohms instead of 8 ohms into a crossover calculator, we might achieve a more favorable outcome. Nevertheless, due to the fluctuating impedance, predicting the results becomes challenging, making it difficult to determine the optimal choice.
If the objective is to stabilize the impedance load of the woofer, there are potential solutions available. However, these solutions can become intricate and potentially costly. Delving into the intricate details of crafting the ideal crossover leads us to the realm of Zobel Networks. While we occasionally employ Zobel networks, our focus primarily centers on crafting uncomplicated crossover designs that remain cost-effective to produce.
When it comes to crossover design, we start by examining the impedance and frequency responses. This analysis aids us in determining the best approach. We have already measured impedance, our next task is to measure the frequency response. This step assists us in selecting a starting filter frequency. However, it’s common for us to experiment with various filter configurations before pinpointing the one that works the best.
The frequency response measurements have all been conducted utilizing a clio system paired with an appropriate microphone. As these measurements predominantly serve the purpose of illustrating comparative outcomes for educational intents, we haven’t taken the effort to meticulously calibrate the settings to precisely 1W/1M. The measurements were taken within a standard room, where minimal sound-absorbing materials have been strategically positioned on the walls to curtail reflections. It’s important to note that all the measurements presented below capture room reflections and anomalies induced by the environment. Consequently, they don’t offer a true representation of the exact response.
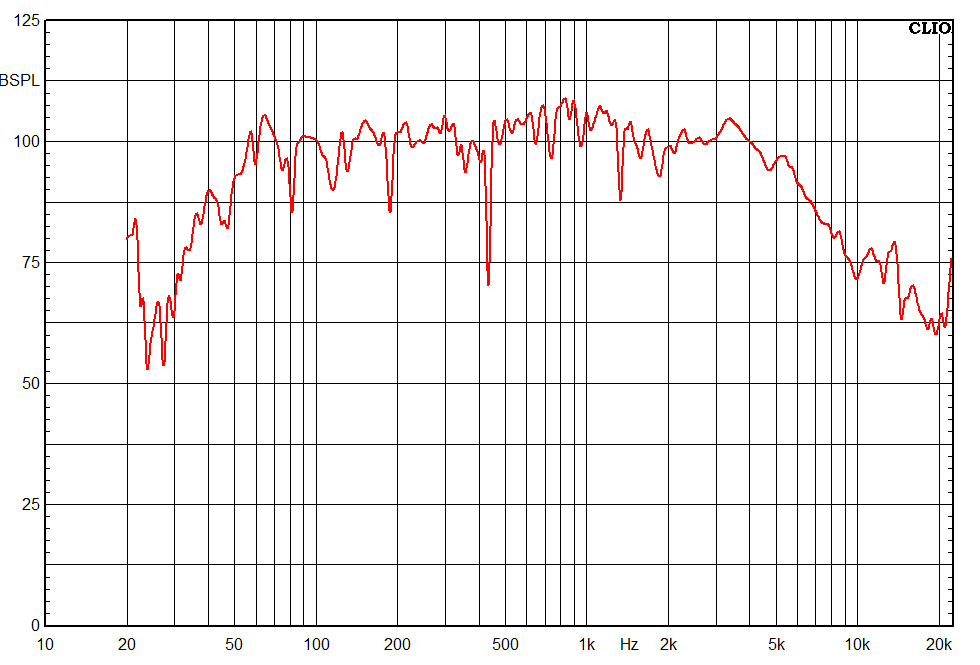
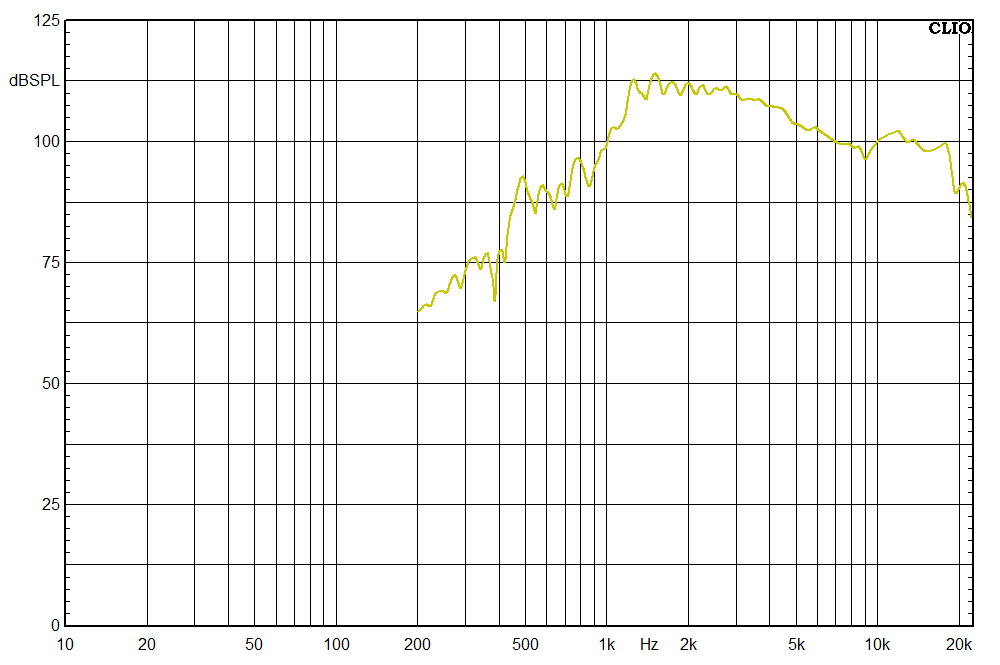
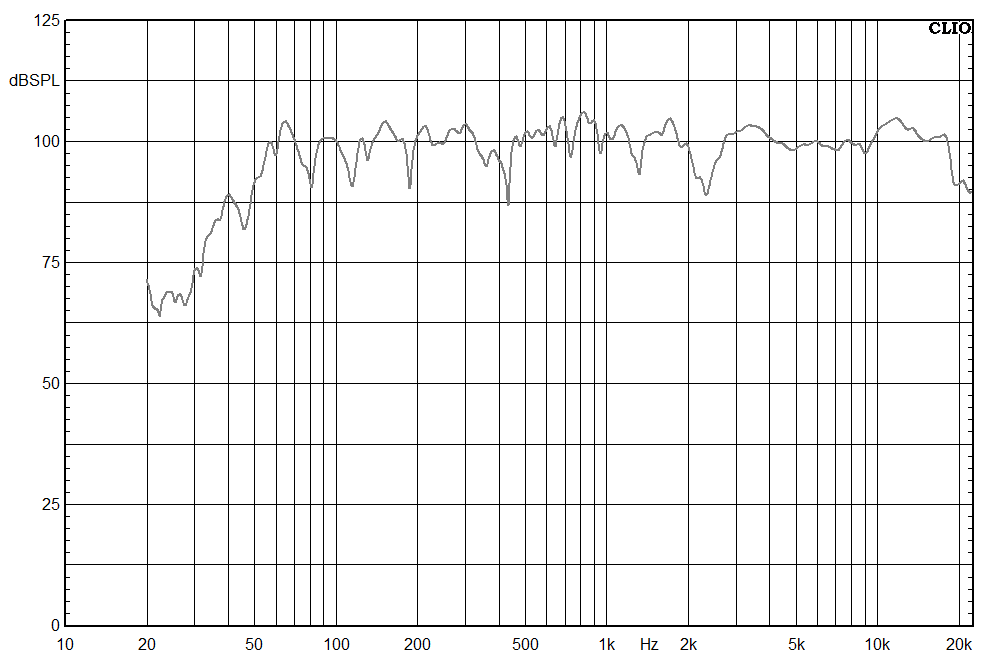
Displayed below is the on-axis measured frequency response of the 8NDL51 without any filters. The response exhibits a natural decline from approximately 4kHz; with a distinct peak at 3.5kHz. This peak aligns itself within the midrange vocal region, which coincides with the area of greatest sensitivity for the human ear. Naturally, we aim to mitigate the prominence of this peak in the final outcome. If the 8NDL51 and Tweeter were to sum constructively at this frequency, the overall sound could be a little harsh. Consequently, our strategy involves selecting a low-pass filter slope that effectively attenuates the 3.5kHz peak.
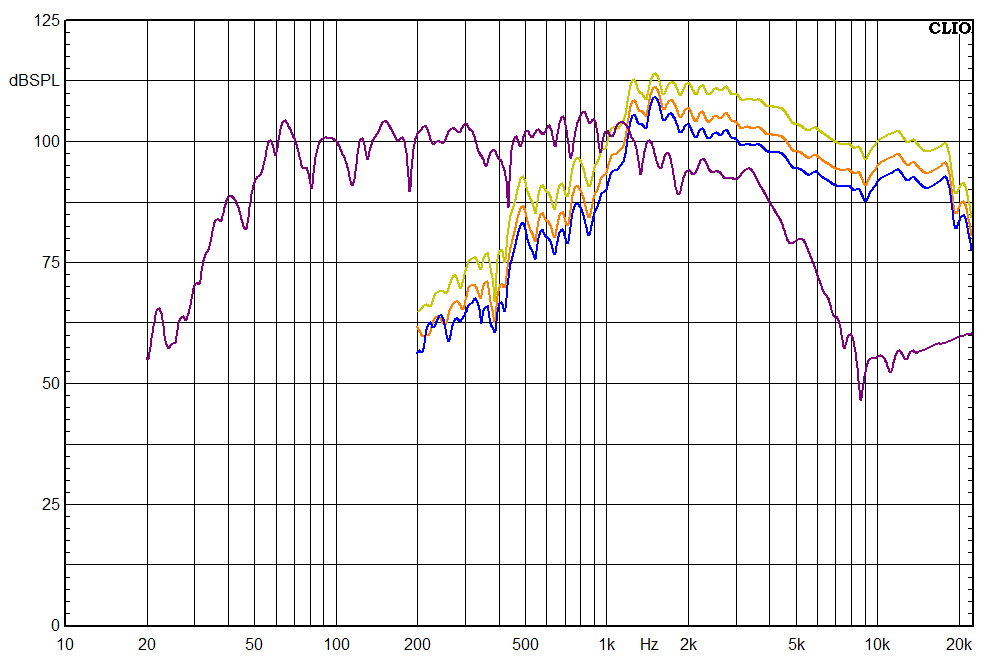
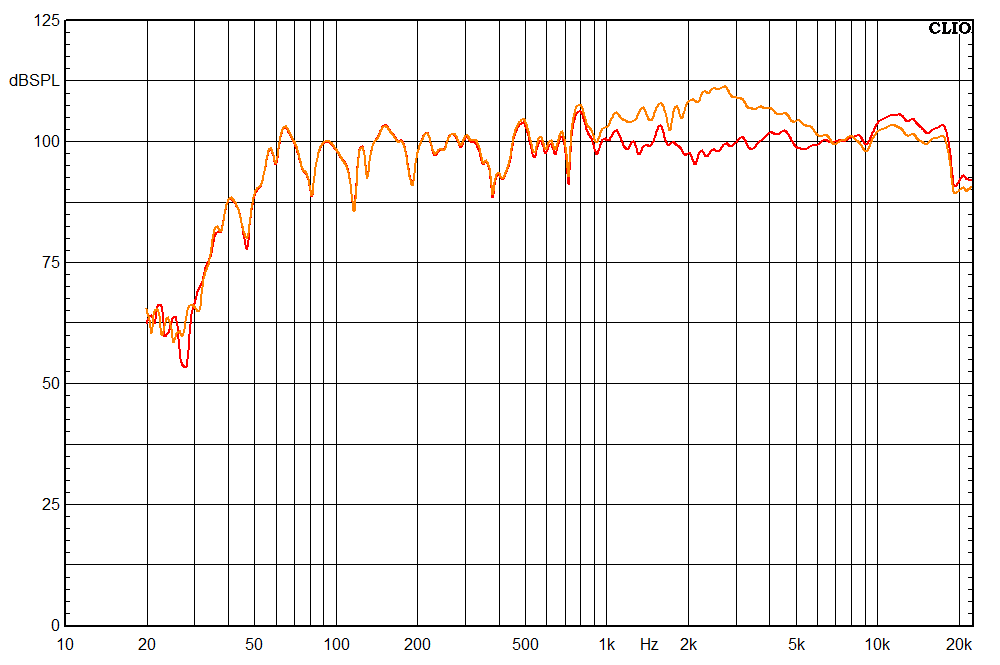
For the purpose of comparison, we started our experiment with a conventional Butterworth 12dB low pass filter at 2500Hz, calculated using default 8 ohm value for impedance. It’s worth noting that the bump down at 30hz was caused by background noise whilst measuring, and should be disregarded. The measured frequency response doesn’t look like the filter is actually working at 2500Hz -this is partly due to the peak at 3.5khz, but also due to the fact that the impedance of the woofer isn’t 8 ohms at the crossover frequency, so the calculated component values wont actually make a Butterworth filter, and will also shift the filter frequency a little higher. This was expected, but we took this step anyway as part of the process to show that default crossover values calculated for 8 ohms will often be incorrect.
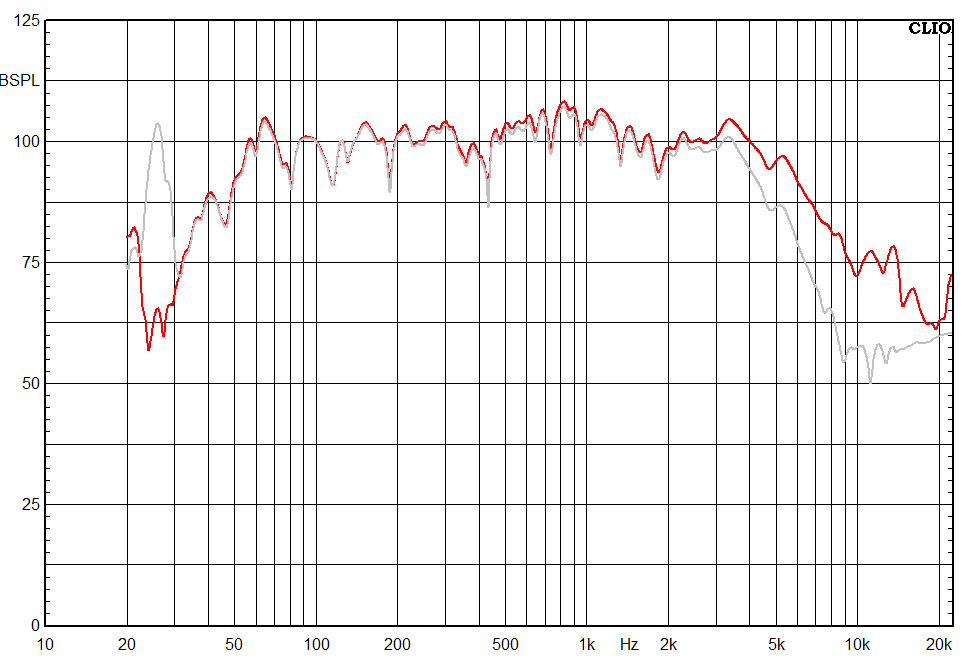
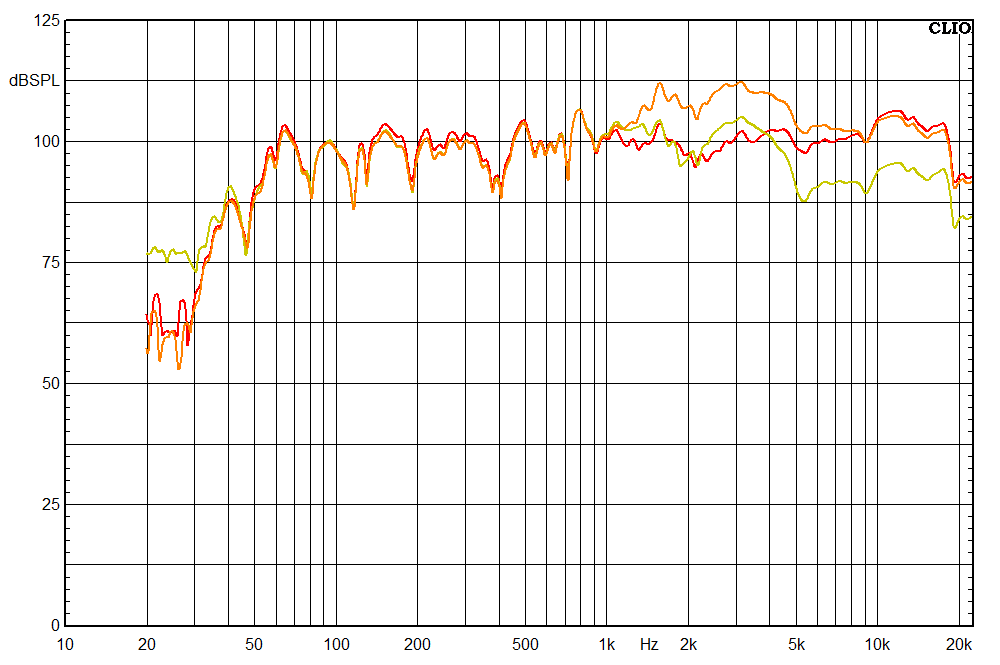
To progress further, we conducted another measurement using a standard Butterworth 12dB filter at 2500Hz. However, this time the calculations were based on an 11 ohm impedance, which is the actual impedance value we’re working with. The outcome of this measurement is illustrated in green in the graph. This adjustment has led to a subtle reduction in the range between 2000Hz and 3000Hz. However, the peak around 3500Hz persists, and the response doesn’t exhibit a substantial decline until after this peak. In order to achieve a satisfactory final outcome, we need to address this peak.
From experience I’m aware that peaks within the range of 1500Hz to 4000Hz could result in a somewhat shrill sound. While it’s acceptable to rectify this issue using a graphic equalizer, I prefer, whenever possible, to devise crossover designs and opt for components that preemptively mitigate these unfavorable peaks.
At this point, it’s pretty common to start playing around with a bit of trial and error to find the right filter that works for getting the woofer’s sound just right. Normally, I kick things off by tinkering with various filter frequencies, gradually going lower until peaks are sufficiently suppressed, and also experimenting with either Butterworth or Linkwitz-Rileyalignemtn . This step-by-step process helps us dial in the woofer’s sound.
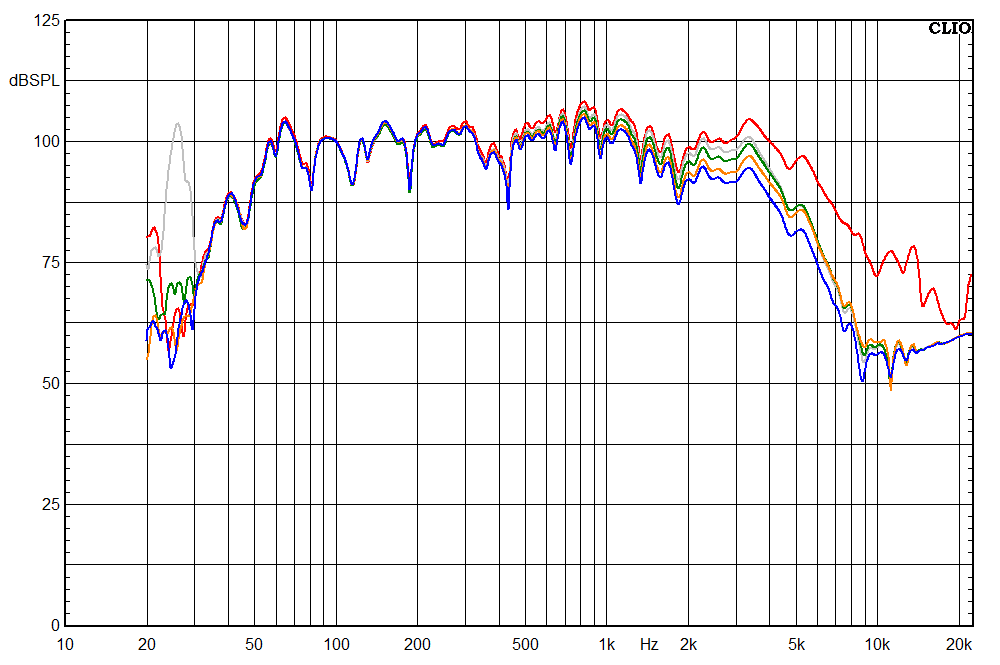
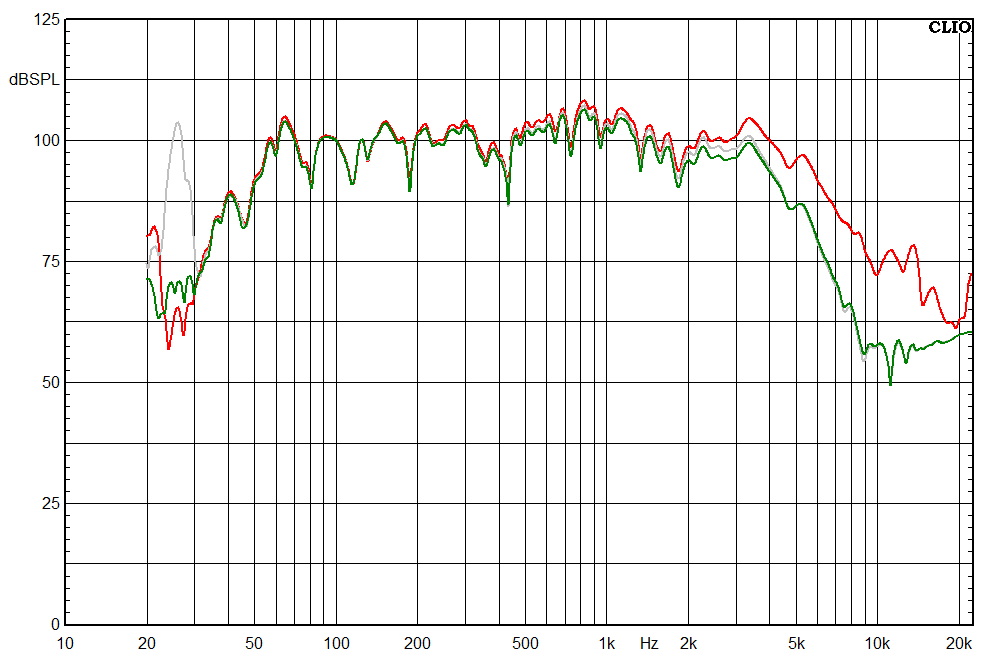
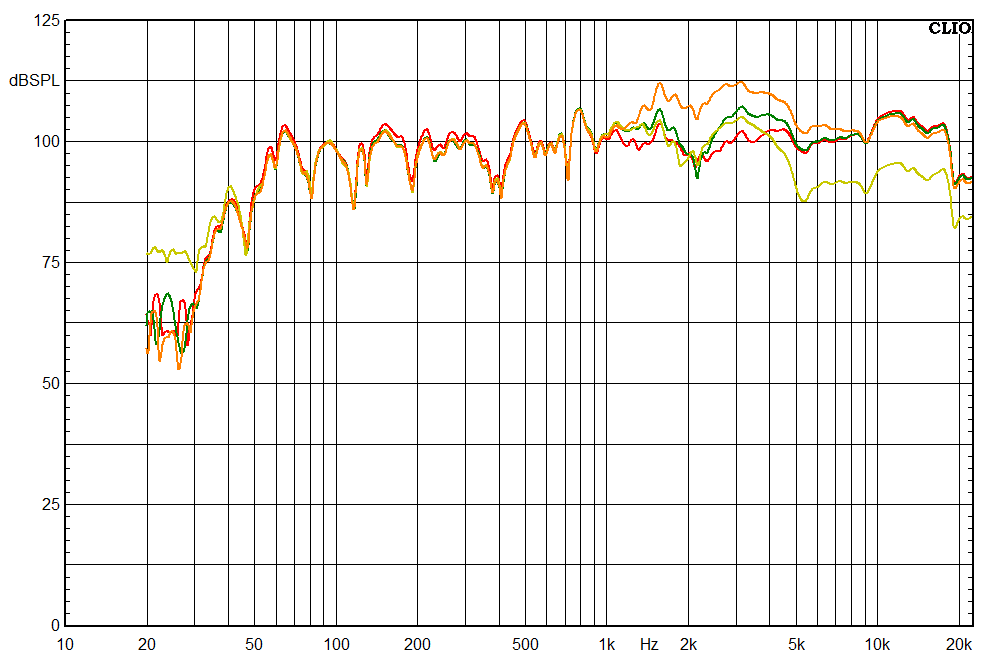
The orange plot is a Linkwitz-Riley 12dB filter at 2500Hz, calculated with 11 ohm impedance, and the blue plot is Linkwitz-Riley 12dB filter at 2000Hz, also calculated for 11 ohm impedance. The peak at 3.5kHz is being gradually suppressed, and getting closer to the frequency response I want from the 8″ woofer.
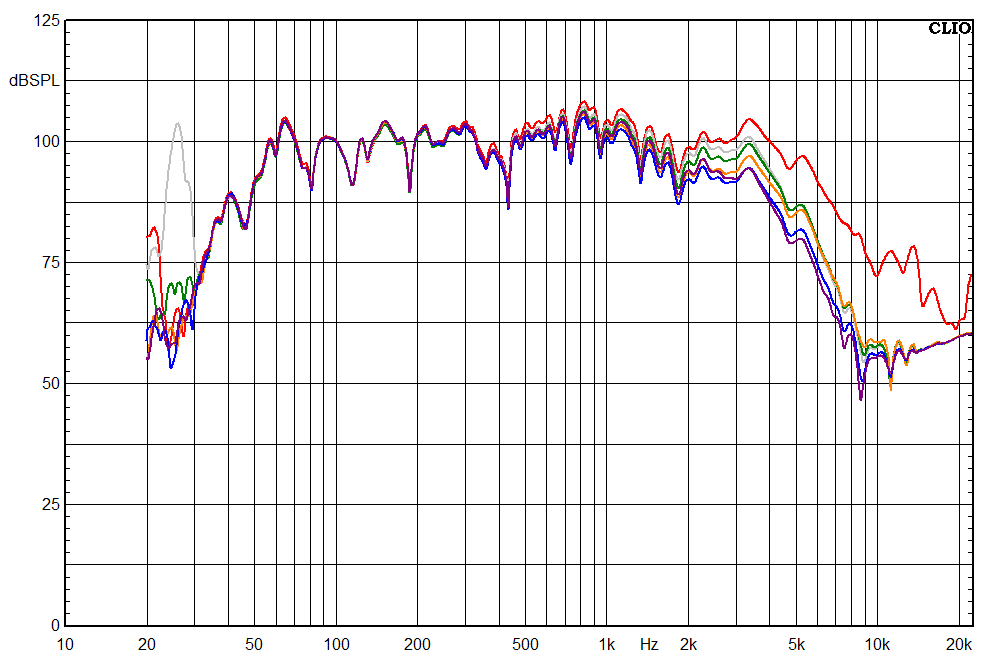
In the final test, I experimented with a 12dB Butterworth filter set at 1.65kHz, with calculations based on an 11 ohm impedance. The result is represented by the purple plot. It’s getting a bit busy, with multiple results, and I omitted a 4 or 5 other test results which would have made the graph undecipherable. Here’s what’s happening in the final test: this response is a tad louder around 2000Hz compared to the blue plot, but then it takes a steeper plunge after that 3.5kHz peak, which is about as good as I can hope for.
Instead of the typical 2.5kHz low pass filter calculated for 8 ohms, we opted for a 1.65kHz low pass filter calculated for 11 ohms. And already, you can see this is shaping up to be something more bespoke than your standard off-the-shelf crossover. A 2.5kHz low pass would utilise a 0.72mH inductor and 5.6uF Capacitor, we ended up with 1.5mH and 6.3uF – significantly different.
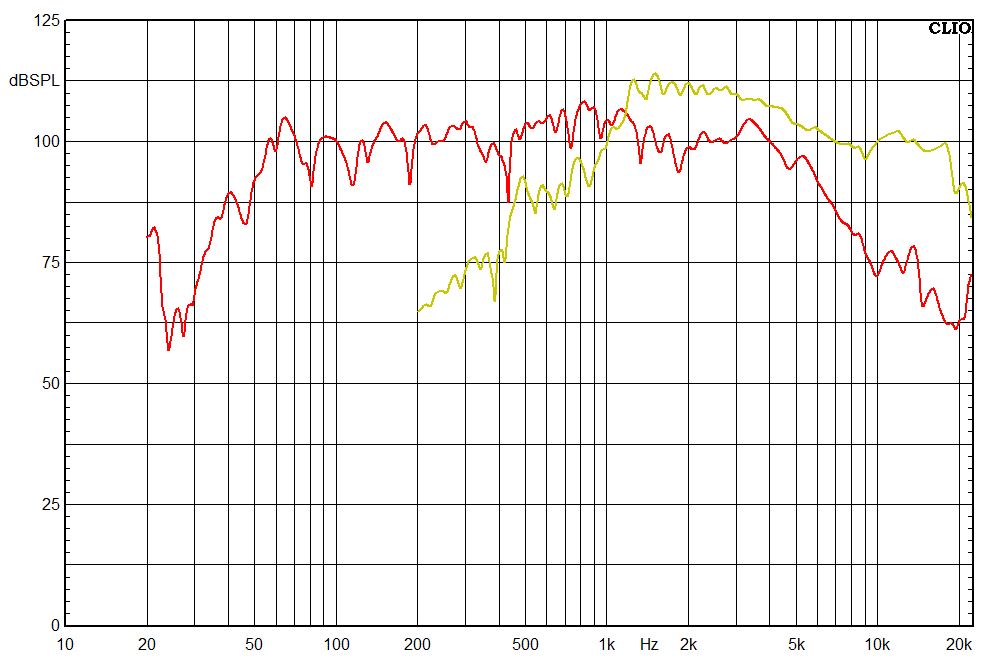
To make things a little easier to see, in the graph below the red plot is the original frequency response of the woofer, and the purple plot is the final low-pass filter we decided to use. We needed the woofer response around 2.5kHz to be lower compared to 1000Hz and under , as the woofer’s response will couple with the tweeters response around this frequency.
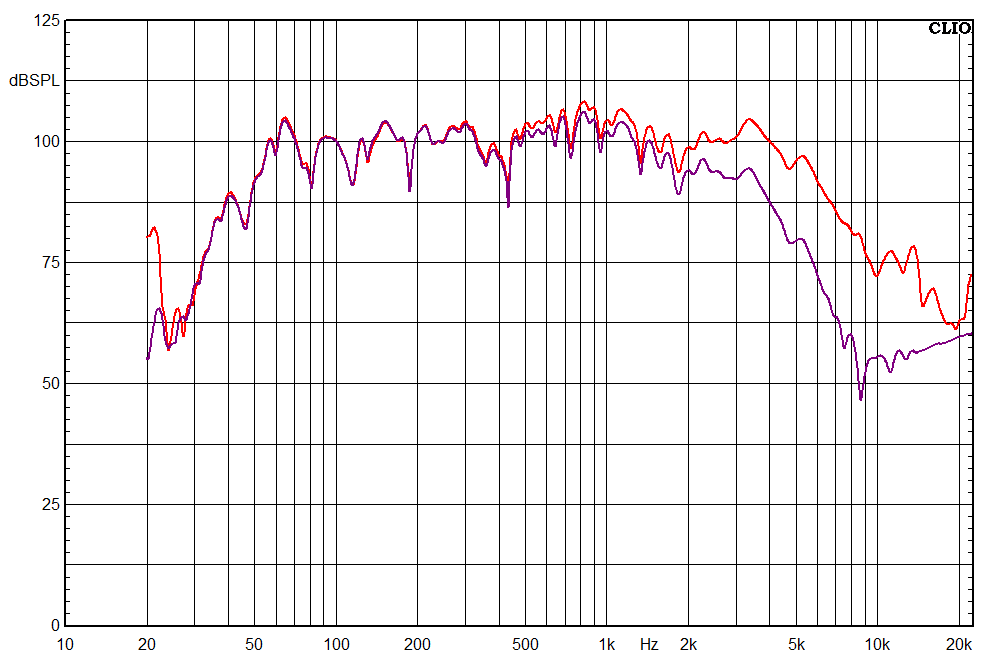
Using the lower filter frequency of 1.65kHz has had the added benefit of attenuating the response around 500-1000Hz and bringing it more level to the response between 50hz and 200Hz. This will benefit the final result by allowing for a more balanced mid-range response.
So reaching this decision on the low pass filter for the woofer has been influenced by the impedance measurements of the woofer, which resulted in a different impedance being used for the crossover calculations. In addition to this I have looked at the frequency response and aimed to smooth the mid response and suppress any large peaks on the response. I have used past experience to judge the result from the 8″ I am aiming for, and settled on a solution once the response is looking close to what I am aiming for.
Now we move on to the tweeter. For this project we chose the B&C DE12TC, and repeated the same process of measuring impedance and frequency response. You’ll notice the frequency response plots dont got down to 20Hz, we changed the cut-off frequency as we don’t want to put bass frequencies into a tweeter.
DE12TC Impedance measurement:
Again we have bumps in the impedance of the tweeter, however tweeters are more problematic, as the impedance bumps are often very close to the crossover frequency. The vary impedance cant interact badly with a passive crossover. These impedance bumps are caused by natural resonant properties of the tweeter, and personally I find if the crossover point is too close to one of these bumps the sound is not particularly nice. So I try to keep the crossover points away from the impedance bumps. Again we have the same problem of not being sure what the impedance is at the crossover point, we have a peak of around 10.5 ohms just below 3khz, dropping down to 7.5 ohms and then slowly rising again. This is why impedances are stated as ‘nominal’ – they are just a vague average over the operating frequency range.
Below is frequency response of the DE12TC.
This might not be the smoothest response, but it’s quite par for the course with most compression drivers. The good news is that nothing here is beyond refinement with a touch of EQ. However, I usually try to work in attenuation and EQ directly into the crossover. This helps harmonize the woofer and tweeter in a way that minimizes the need for extra EQ down the line.
But let’s take a step back. Our first task is to examine the frequency response of both the woofer and the tweeter, and then compare the two. This comparison will give us a solid foundation to figure out the best approach for smoothing out the frequency response of the tweeter so that it blends seamlessly with the woofer.
The first thing that stands out is how the DE12TC is considerably louder than the 8NDL51 from 1kHz to 5kHz – up to 12dB louder (if dB isn’t your thing, just know that 3dB is like doubling the measured sound pressure, and around 10dB is what our ears sense as twice the loudness). If we leave this as is, the end result will likely be a pretty intensely harsh tone with an excessive amount of midrange. To tackle this, we’ll need to dial down the tweeter’s volume to get things balanced.
It’s common, in fact recommended, to utilize an L-Pad arrangement for attenuating high frequencies. This technique is theoretically sound as it facilitates both effective attenuation of high-frequency response and stabilization of the load impedance within the High Pass Filter circuitry. I rarely use L-Pads, and I’ll explain why.
When I build high power crossovers, for speakers of perhaps 600W-1000W, there can be 50-200W of power being directed to the compression driver, sometimes even more in extreme cases. If the compression driver is 9-12dB more sensitive than the woofer (not unusual) you may need to dissipate 100-150W of this power in the resistors. I have cooked enough aluminium clad resistors to have reached the conclusion this is just a bad idea. Dissipating lots of power in resistors invariably leads to reliability issues caused by overheating.
My solution? Use a series resistor. There will be heaps of people that will tell you its a bad idea, but its commonly used in many commercial applications, and power dissipation is the reason. If you need fairly heavy attenuation on an 8 ohm compression driver, you can put another 8 ohm resistor in series with it. The series resistor takes half the power, tweeter takes the other half – but then you have a 16 ohm load. If you know your power calculations, the maths is simple, double the impedance, halve the current. Power = Impedance x current squared. With half the current, you have a quarter of the power, which very effectively reduces total power without having to dissipate loads of heat in resistors.
For serious watts, you can use 2 resistors, spreading the power dissipation over both resistors, and managing the power tidily. There are a couple of drawbacks – first is the fact that the amount of attenuation is proportional to the impedance of the tweeter, so the attenuation will work nicely on this tweeter above 2.5kHz, but not so well below this, as the tweeter has variable impedance (not 8 ohms!) Additionally the combination of impedance bumps, and series resistors messes with the crossover frequencies, particularly the knee in the bend of the high pass filter, as you have variable impedance in the region the filter is transitioning to the pass band, so you end up having to redesign your high pass filter around the attenuation and the new load impedance
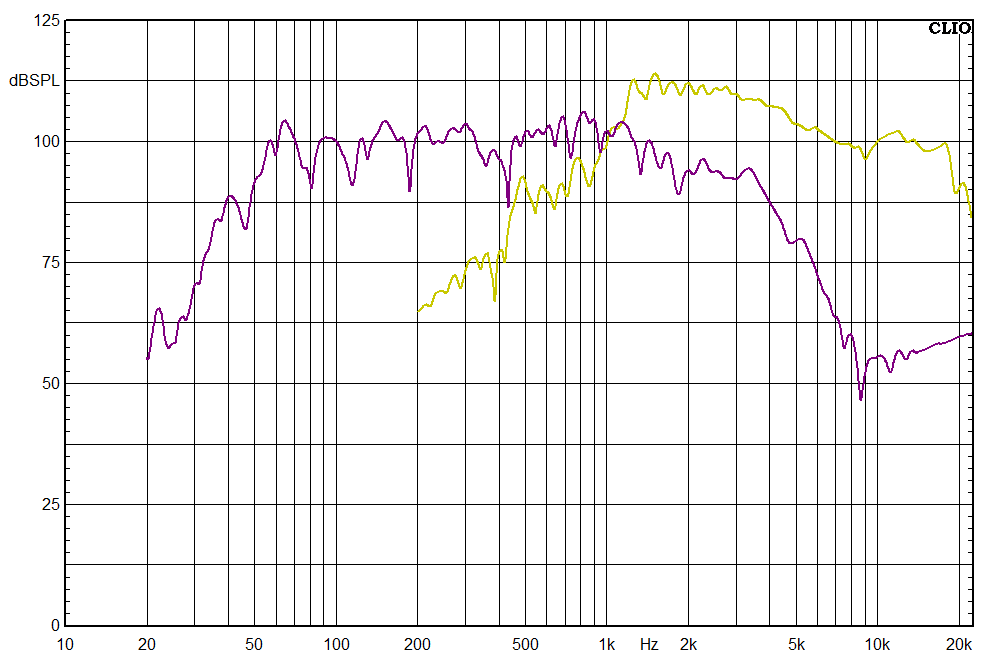
We did some trial and error tests, to work out roughly what attenuation would help balance the sound. The orange plot is with approximately 12 ohms series resistance, and the blue plot is with 24 ohms. There is a noticeable peak at 1.6khz, but we would hope to eliminate this once we have applied a suitable high pass filter. For comparison, the purple plot is the response of the 8″ woofer with the 1.65kHz Butterworth filter applied, and its this purple plot we need to get the tweeter to align to smoothly
Having worked with compression drivers like these before, I skipped a few steps here and just went straight for a filter alignment I expected to work which was a 3.3kHz Butterworth filter This should flatten the response between 1khz and 3khz. You’ll notice also the response is tailing off from around 4khz, due to the fact we are attenuating the high frequencies too much, so we added a 3.3uF bypass capacitor in parallel with the series resistors. This has the effect of adding a hi-shelf EQ to the response, the idea being that you get attenuation below 3-4khz, but at higher frequencies, the attenuation is bypassed by the capacitor, allowing the tweeter to operate at its natural level. If you check out the grey plot, you can see this has worked quite effectively. I could have bored you with multiple iterations of different filters here, so we basically skipped 5-6 tests by utilising past experience.

At this point we have added a filter and some EQ, and converted the natural response of the tweeter (yellow-green) to a flatter response (grey). Things are looking quite promising here, but what we have are two independent measurements, purple for woofer, grey for tweeter, but this is not a system measurement of the two together. The next result shows the frequency responses with woofer and tweeter together as a system.
Taking a closer look at the crossover region, there are 2 plots, one green and one blue. Green was with the tweeter in standard polarity, and blue with the tweeter with inverted polarity. Inverting polarity is usually necessary due to phase shift cause by a filter. If we had used a 2.5khz Butterworth high pass and low pass, we would normally run the tweeter in reverse polarity to counteract the phase shift in the crossover. The frequencies chosen: 1.65khz and 3.3khz, are an octave apart, and in the past we have found that having the filter frequencies exactly an octave apart means you don’t need to invert the polarity of the tweeter, and the phase response across the crossover region remains fairly linear. Sadly in this instance it didn’t work. In fact neither configuration worked particularly well. There are other factors, the physical position of the horn makes a difference -you want the voice coils of woofer and tweeter in the same vertical plane to avoid the need for time alignment. Despite trying to ensure the components were arranged correctly, and trying a few subtle variations of crossover components, we couldn’t quite get the flat response we were after. The end result was by no means awful, but there is a noticeable dip at 2.5khz which we just couldn’t rectify using this design approach. The best final frequency response we could achieve is below.
So the response has a few bumps, but we have a working design, which is potentially good enough for some applications. In fact I have had people request that we intentionally put in a slight dip in the frequency response between 1khz and 3khz to give a slight smiley face EQ effect. In this case, the dip is around 10dB, a little more than I would like. I have had very good results with this approach in the past, and got some very smooth sounding speakers, but in this instance it just wasn’t quite right so I decided to go back to the beginning and take a different approach. I went back to the frequency response of the tweeter, to take a closer look, and consider an alternative approach. At 5kHz and above, the tweeter is approximately equal in output to the median level of the woofer. Below 5khz, it gradually rises in output, until its around 12db higher at 2.5khz. This is a pattern I have seen before, and already know how to deal with.
The downward slope of the tweeter’s response is approximately 12db over an octave, exactly the opposite of the slope you would get from a second order high pass filter. Applying a 12db/octave high pass filter at around 5khz, we can effectively rebalance the response of the tweeter, flattening it below 5Khz. Here we have the plots of the 1.65kHz low pass applied to the woofer (purple) and a 5kHz (approx) high pass applied to the tweeter (green). You can clearly see the high pass filter has done its job and flattened out the response from the tweeter.
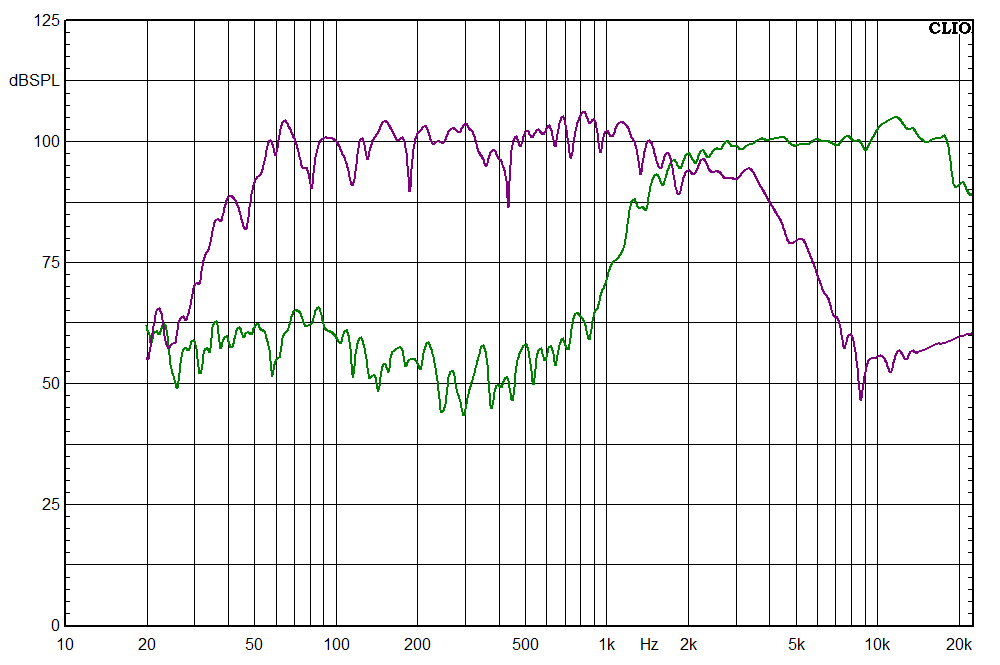
This is looking very promising, shifting the filter point up to around 5kHz has created a fairly flat response from 2.5kHz to 10kHz on the HF device. There is a small peak just above 10kHz, which isn’t a bad thing usually, and will give a little HF sparkle at the top when listening directly on-axis. I did do a few iterations of small filter tweaks and measurements after this, and ensuring the physical positioning of components was just right, but eventually got the result we wanted in the red plot below:
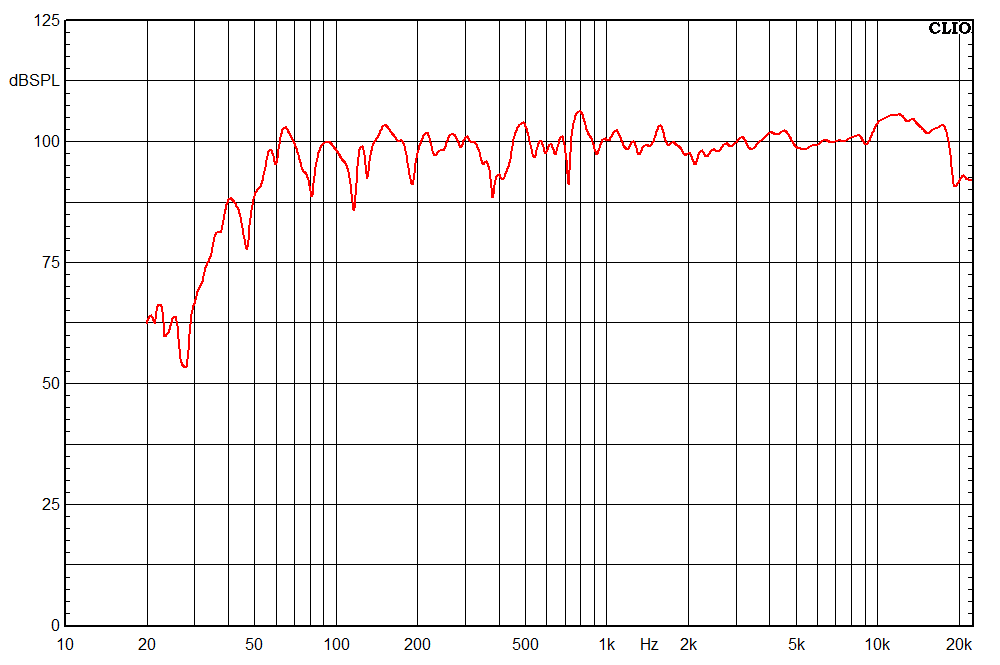
Yes we know its not completely flat. As mentioned at the outset, the environment was such that room anomalies would feature in the measurements. The aim here was to make a crossover that balanced woofer and tweeter, and had a smooth transition from woofer to tweeter without any massive peaks or troughs, which has been achieved.
Going back to the reason for writing this article basically to show how standard off the shelf crossovers don’t usually work, we did a measurement with a standard 2.5khz Butterworth crossover calculated for 8 ohm components, you can see the result in the orange plot:
If you understand the graph, you’ll be getting the earplugs ready. It has the potential to sound pretty awful with a 12-15db hill across the midrange and lower hf which will require significant EQ adjustment to rebalance.
The yellow-green plot below is with attenuation resistors added to the tweeter on thedefault 2.5khz crossover, whichjust seems to be introducing more problems. The orange plot is slightly different here, in the previous graph I recalled a measurement with a different mic position. The fact that the frequency response has changed a fair bit from just a small change in mic position is an indicator of phase response problems in the crossover. Basically the woofer and tweeter are not aligned, and in some listening positions will couple constructively, and in other positions couple destructively, causing hot spots within the listening area. The key point here is that the route we are going down, with the off the shelf crossover is not shaping up to be a good solution, despite us trying to make adjustments to rebalance the sound
Whilst I knew I was heading down a dead end, for purposes of completing the test, I added a 3.3uF bypass capacitor on the attenuation resistors, to bring back the upper HF, this is shown in the green plot. Its a little better, but there is a sharp dip at 1.8kHz and a lump at 2.5kHz which are both undesirable, and not as good as the red plot. A lower value capacitor, such as 2.2 uF or 1uF would tame the 2.5kHz bump, but I already knew there were phase response issues with this solution. A little more refinement, and potentially I could have got the 2.5kHz off the shelf default crossover sounding OK on-axis, but I know it would have had issues off-axis.
So its clear that the best frequency response has been obtained using a customised crossover following non-standard practices. At the outset, we were considering a standard 2.5kHz crossover. We ended up with a 1.65kHz low pass and high pass around 5kHz, but with the intent of flattening the frequency responses of the devices. There will probably be critics of this approach, as it doesn’t follow the text book methods everyone has been preaching for years. However, its a simple solution, requiring fewer crossover components, keeping size and cost to a minimum. Also, it works, and works quite well – so why not use it? I have seen similar crossovers used in ‘audiophile’ speakers costing many thousands of pounds. It may be possible to make a better crossover incorporating a zobel network, a large oversized L-Pad attenuator, and possibility using third or fourth order filters -the resulting crossover board could easily end up being larger than the speaker cabinet. This design approach provides for a compact crossover, which can be easily fitted inside a typical 8″ + 1 ” speaker cabinet.
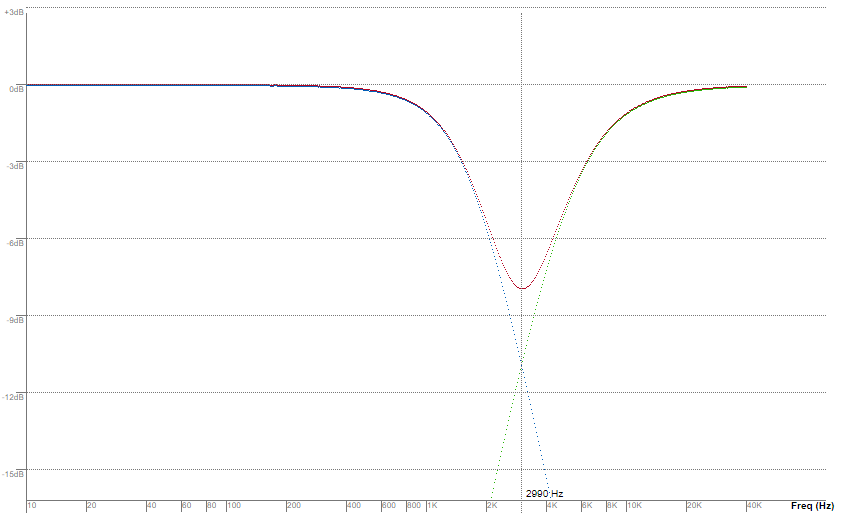
Using a circuit simulation tool I wrote, I put the final design components in and produced the graph below. The tool calculates the attenuation of the filter from the component values and impedance entered, allowing you to calculate the theoretical frequency responses of the filters, and the summed acoustic power response. The result shows the attenuation relative to 0dB of the high pass (green) and low pass (blue) sections. It also shows the summed response in red (ignoring any phase response issues). The ‘crossover’ point works out to be around 3kHz – this is where the high pass and low pass have equal attenuation. Usually the crossover point is defined as the -3dB point of the high pass and low pass filters in a standard crossover. The net result of this circuit design is to put a 7-8dB attenuation across the mid band centered at 3kHz, effectively counteracting the bump in frequency response from the woofer and tweeter when used with a standard off the shelf crossover.
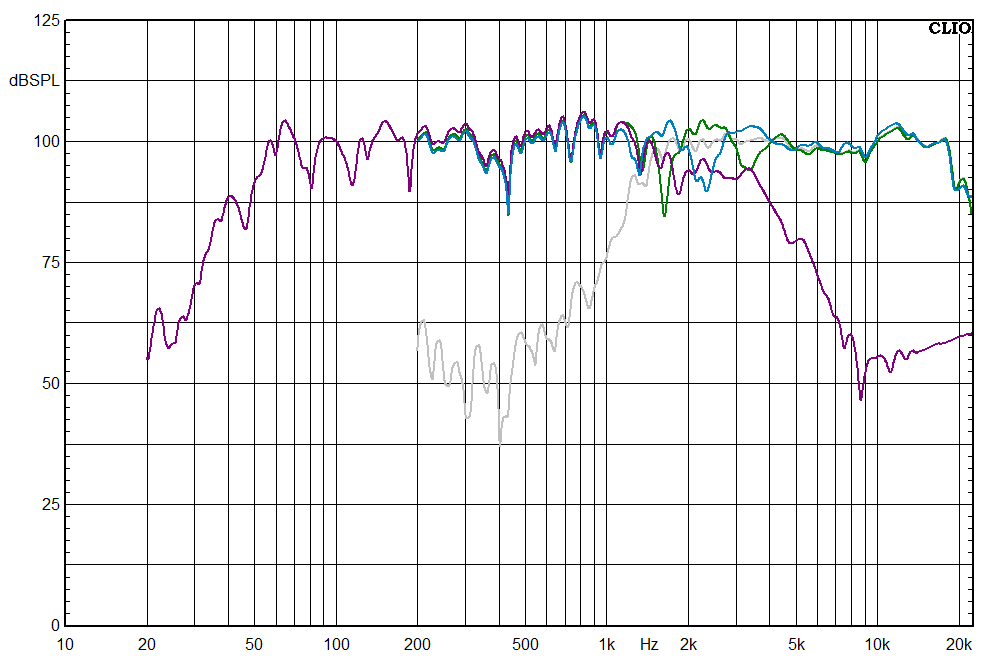
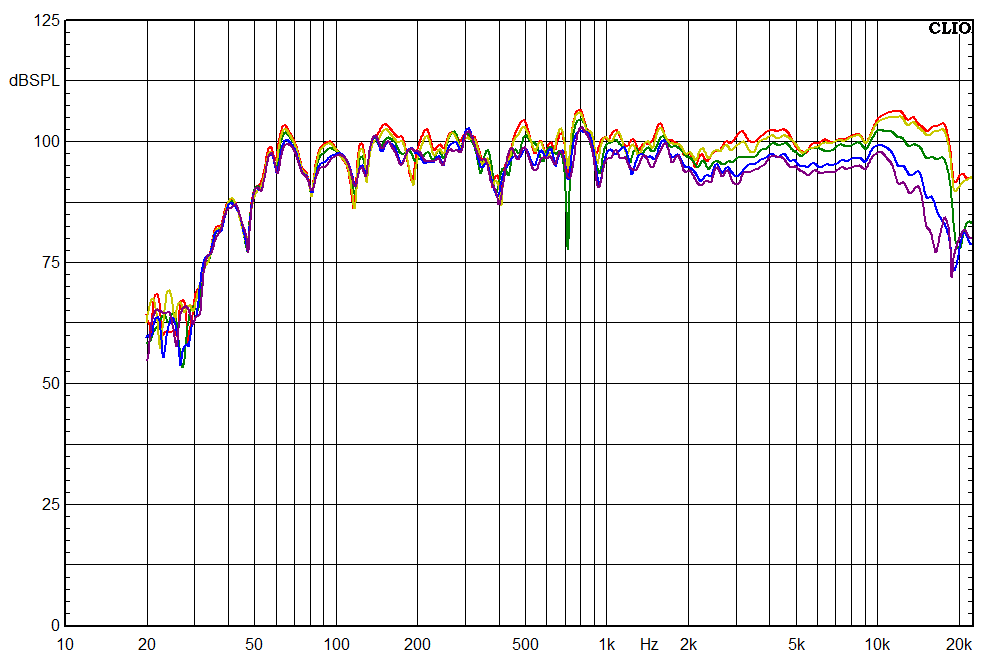
Just to bring things to a conclusion, I thought I would make some extra measurements, to check the speaker performance off-axis. Usually – if there are issues in the phase response of the crossover, which prevent the woofer and tweeter working in harmony, when you move the measurement mic off axis and repeat measurements, you will encounter peaks and troughs at various frequencies. Below are the various responses measured: Red is on axis, Yellow is approx 10 degrees off axis, Green approx 20 degrees, Blue around 30 degrees and purple around 45 degrees. The plots follow the expected results, where the wave guide on the HF device is controlling the dispersion, and the higher frequencies gradually get quieter off axis. The slightly higher response of the HF above 10khz is tamed when listening off axis to help maintain a good sound from multiple angles. Overall I am pleased with the result. All that’s left is to build a prototype cabinet and get some listening tests done.
The process of measuring, trial and error testing, simulations, and repeated iterations can take anything from 15 mins to several hours for each crossover. It depends on how well the woofer and tweeter interact with each other, and whether different approaches offer suitable solutions. Sometimes things just don’t work, and wont work, and no amount of iterations gets a good result – this usually means the wrong drivers have been selected that just don’t want to work together. Initially I started doing crossover designs this for personal research only, but I do offer custom crossover design as a service, with limited availability. It can be a fairly involved process, so the time and effort required needs to be justified, and its simply not viable to do it for everyone who asks. Additionally, I can only do this for components I have access to. If I don’t have the components, I cant measure them, and I can’t test the possible solutions. For best results, I also need the finished cabinet; the position of the drivers with respect to each other, the front baffle design, and other factors all affect the frequency response. Even a grill attached to the front can have an noticeable effect on the HF response, so to get this ‘exactly’ right – its best to have everything exactly as it would be in a finished cabinet. Its is absolutely impossible to design a custom crossover theoretically, you have to be able to measure and test in order to refine the solution.
For anyone who fancies building themselves a super high quality speaker, the components for this project are:
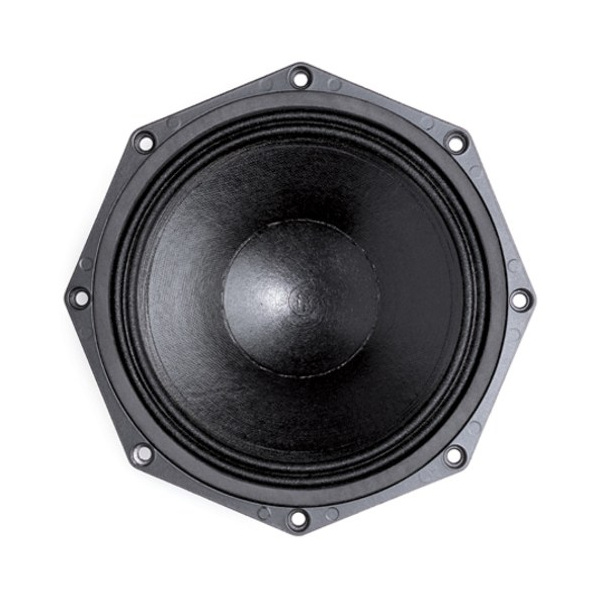 | B&C 8NDL51 (8 ohm) |
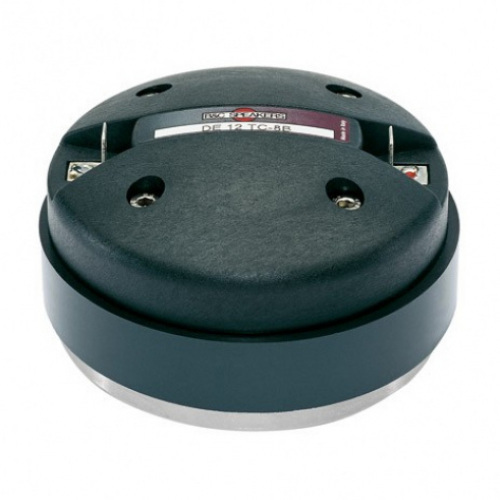 | B&C DE12TC (8 ohm) |
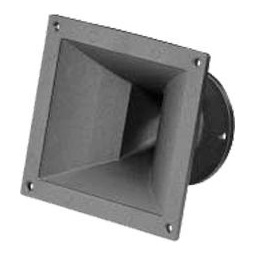 | B&C ME15 horn flare |
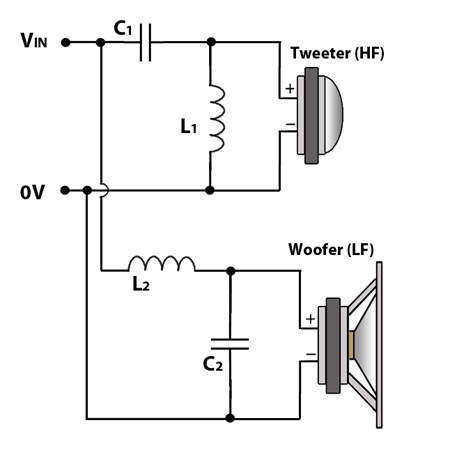
and a custom crossover:
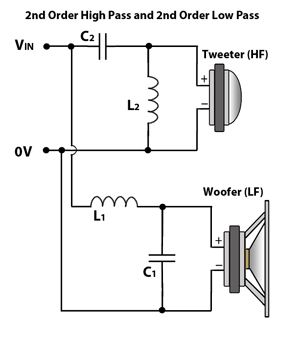
L1 = 1.5mH
C1 = 6.3uF (5.6uF + 0.68uF)
L2 = 0.51mH
C2 = 1.8uF
This design isn’t intended for massive bass response, but you can get sensible levels of bass down to around 50-60Hz at medium volume with the cabinet tuned right. For best results at higher volumes you would need a separate subwoofer.